Press and media
Lead Pipe Map turns the lead service line inventories that U.S. water utilities reported to EPA into searchable pages for every water system, city, county and state. Reporters are welcome to use the data, charts and embeds with a link.
Key numbers
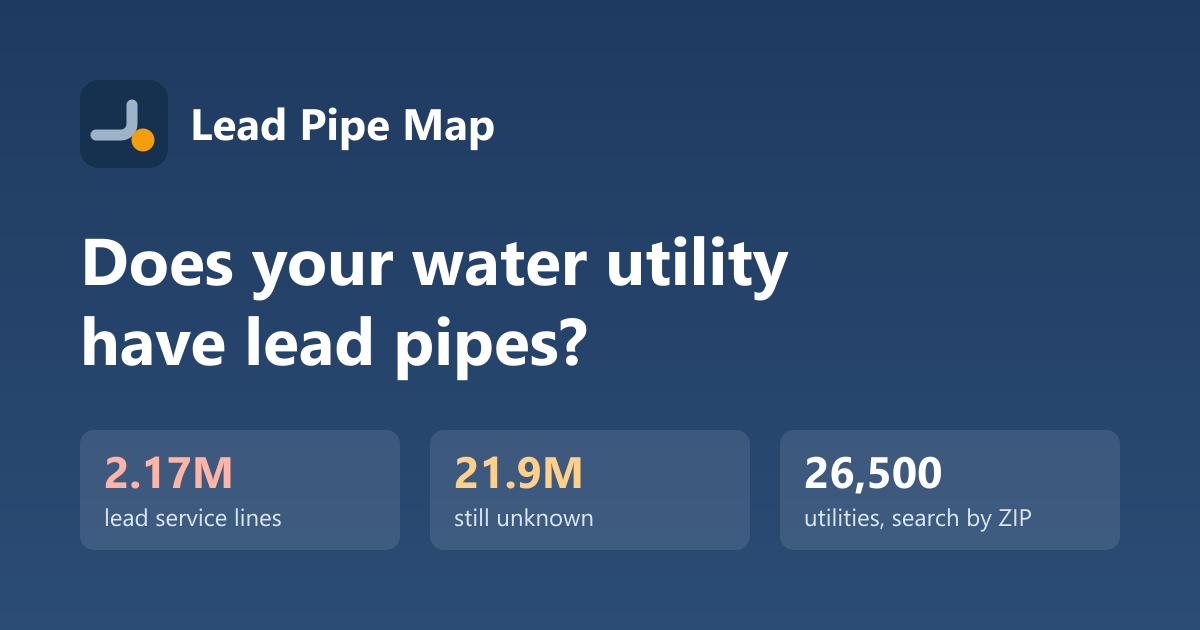
- 2,167,443 lead service lines and 986,963 galvanized lines requiring replacement
- 21,877,944 lines still of unknown material
- 7,629 community water systems with at least one confirmed lead or galvanized line
- Most lead lines: Chicago, IL (360,857), Cleveland Public Water System, OH (144,721), New York City System, NY (124,197), City of Detroit, MI (80,715), Milwaukee Waterworks, WI (65,331)
Resources
- National data report with charts and findings
- Rankings: most lead lines, highest share, most unknown, largest cities, action level exceedances
- CSV download of every community water system (CC BY 4.0)
- Embeddable cards: copy the code at the bottom of any water system page
- Local angles: every state links to its cities and counties
Story ideas
- Which local systems still list most of their lines as "unknown," and when will homeowners find out?
- How a city's share of lead lines compares with its state and the nation.
- Who pays for the private side of the line in your area, and how the December 31, 2037 federal deadline affects it.
- Systems whose latest lead sampling exceeded the action level.
Data notes
Counts are self-reported by utilities through their states (EPA SDWIS service line inventory, 2026 Q3). They can lag local inventories and don't describe individual addresses. See methodology.
Contact
Email press@leadpipemap.com for interviews, local data cuts and questions about the data.